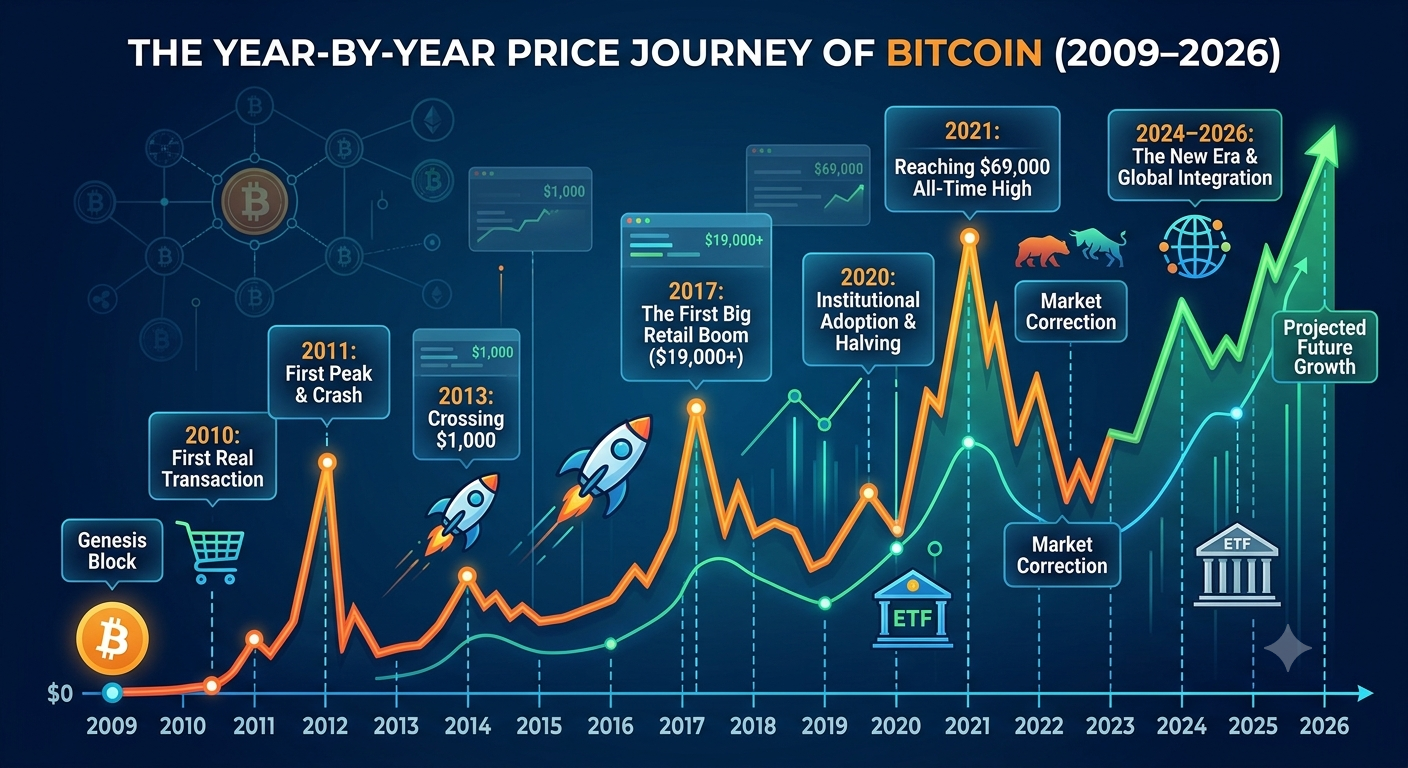
From Zero to Digital Gold: The Year-by-Year Price Journey of Bitcoin (2009–2026)
Since the Satoshi Nakamoto whitepaper materialized on October 31, 2008, Bitcoin has evolved from an obscure cryptographic experiment into a globally recognized institutional macro asset class. Over seventeen years, Bitcoin’s trajectory has been defined by dramatic bull-and-bear market cycles driven by network halvings, global liquidity trends, regulatory shifts, and institutional adoption.
Yearly Performance at a Glance (2009–2026)
| Year | Primary Trend | Price Action Summary | Approx. Year-End / High | Annual Return / Impact |
|---|---|---|---|---|
| 2009 | Genesis | Mined Genesis block; no active trading market. | $0.00 | N/A |
| 2010 | UP | First exchange launch; famous 10,000 BTC pizza purchase. | $0.30 | Exponential |
| 2011 | UP | First major parabolic spike to $30 before sharp crash. | $4.70 | +1,400%+ |
| 2012 | UP | First Bitcoin Halving (50 to 25 BTC reward). | $13.50 | +180% |
| 2013 | UP | First break above $1,000 across multiple rallies. | $750–$1,100 | +5,400% |
| 2014 | DOWN | Mt. Gox collapse; multi-year bear market starts. | $320 | -58% |
| 2015 | UP | Accumulation floor; gradual recovery. | $430 | +35% |
| 2016 | UP | Second Bitcoin Halving (25 to 12.5 BTC). | $960 | +124% |
| 2017 | UP | Retail mania; peak at $19,700. | $14,000 | +1,369% |
| 2018 | DOWN | "Crypto Winter"; ICO bubble bursts. | $3,700 | -73% |
| 2019 | UP | Relief rally back above $13,000. | $7,200 | +92% |
| 2020 | UP | Third Halving + post-COVID stimulus surge. | $29,000 | +303% |
| 2021 | UP | Institutional wave; peak at $69,000 in November. | $46,000 | +60% |
| 2022 | DOWN | Fed rate hikes; Terra/Luna & FTX crashes. | $16,500 | -64% |
| 2023 | UP | Banking sector anxiety + spot ETF anticipation. | $42,000 | +155% |
| 2024 | UP | Spot ETFs launched; Fourth Halving; breaks $100k. | $95,000–$100,000 | +121% |
| 2025 | UP | Macro expansion; peak at all-time high of $126,198. | $85,000 | Peak +26% / Year-end -6% |
| 2026 | DOWN | Cyclical drawdown; consolidation in $60k–$65k range. | $64,500 (YTD) | Down YTD (~ -26%) |
Detailed Chronological Breakdown
2009–2012: Inception & Price Discovery
- 2009 (Genesis): The network launched on January 3, 2009, when Satoshi Nakamoto mined the Genesis Block. There was no monetary exchange rate; coins were circulated solely among cryptography researchers and hobbyists.
- 2010 (UP): Bitcoin established its first market pricing. In May 2010, developer Laszlo Hanyecz bought two pizzas for 10,000 BTC, marking the first recorded commercial transaction. By year-end, the exchange rate rose to ~$0.30.
- 2011 (UP): Bitcoin surged from $0.30 to a peak of $30 in June—a 100x increase—before suffering its first major drawdown back to $2–$5 following early exchange security breaches.
- 2012 (UP): Bitcoin underwent its First Halving in November 2012 (reducing block rewards from 50 to 25 BTC). Prices steadily recovered throughout the year, closing near $13.50.
2013–2016: The First Mainstream Wave & Mt. Gox Collapse
- 2013 (UP): A landmark year featuring two massive surges. Early in the year, Bitcoin crossed $100, and by November 2013, propelled by adoption on Mt. Gox, it broke $1,000 for the first time.
- 2014 (DOWN): The world's dominant exchange, Mt. Gox, filed for bankruptcy following a severe hack. Heightened regulatory scrutiny pushed Bitcoin into a long bear market, falling to ~$320 by year-end.
- 2015 (UP): A period of consolidation and base-building. Prices found a bottom near $170 before gradually climbing back above $400.
- 2016 (UP): The Second Halving in July (cutting rewards from 25 to 12.5 BTC) restricted new supply. Driven by rising global interest, BTC ended the year near $960.
2017–2019: ICO Mania & Deep Winter
- 2017 (UP): One of the most explosive bull runs in modern financial history. Spurred by retail interest and the Initial Coin Offering (ICO) phenomenon, Bitcoin soared from $960 to a high of ~$19,700 in December 2017.
- 2018 (DOWN): The "Crypto Winter." Regulatory crackdowns on ICOs and over-leveraged market structures caused Bitcoin to shed over 73% of its value, falling to a cycle low near $3,100 in December.
- 2019 (UP): A notable relief rally. Bitcoin rebounded from $3,700 to a mid-year peak of $13,800 before settling around $7,200 by December.
2020–2022: Institutional Adoption & Macro Shocks
- 2020 (UP): Following a sharp liquidity crash in March, central bank monetary expansion and institutional purchases (MicroStrategy, Tesla) drove a historic surge. The Third Halving occurred in May (12.5 to 6.25 BTC), and BTC closed the year at ~$29,000.
- 2021 (UP): Bitcoin reached dual record highs—$64,000 in April and $69,000 in November. El Salvador adopted Bitcoin as legal tender, while mining shifted globally following regulatory bans in China.
- 2022 (DOWN): Global central banks aggressively raised interest rates. Combined with systemic collapses (Terra/Luna, 3AC, and FTX), Bitcoin fell 64% to a cycle low near $15,500.
2023–2026: Spot ETFs, All-Time Highs & Market Reset
- 2023 (UP): Bitcoin rebounded strongly as global inflation cooled and spot ETF applications from major asset managers gained momentum. BTC ended the year up 155%, finishing above $42,000.
- 2024 (UP): US spot Bitcoin ETFs were officially approved in January, unleashing substantial institutional capital. The Fourth Halving took place in April (3.125 BTC reward), pushing BTC to set new highs and cross $100,000 late in the year.
- 2025 (UP): Broad macroeconomic expansion propelled Bitcoin to a new historic peak of $126,198 in October 2025. Late-year profit-taking brought prices back to ~$85,000 by December.
- 2026 (DOWN): Following its late-2025 peak, Bitcoin entered a cyclical drawdown and market consolidation phase, trading in the $60,000–$65,000 range through mid-2026.
Key Drivers of Bitcoin's Price Cycles
- The 4-Year Halving Mechanism: Approximately every four years, Bitcoin's block reward cuts in half. Historically, the supply contraction produces major market movements in the 12 to 18 months following the event.
- Institutional Infrastructure: The evolution from unregulated retail exchanges in 2011–2017 to regulated spot ETFs and enterprise custody solutions transformed liquidity and reduced barrier-to-entry for institutional capital.
- Macroeconomic Liquidity: Bitcoin has shown high sensitivity to global fiat supply dynamics, central bank interest rate policy, and broader macroeconomic conditions.